
MODULE 1

MODULE 1
In this module you’ll gain some fundamental knowledge about systems mapping through an example of opioid use, a serious global problem that many communities are struggling to manage. In the U.S. alone, over 75,000 people die annually from opioid overdoses.
Imagine that the mayor has appointed you to a commission that is considering a proposal to make Naloxone widely available in order to reduce deaths from opioid overdoses in your city. Spraying Naloxone—which is sold as a nasal spray under the brand name Narcan®—into a person’s nose can rapidly reverse an opioid overdose. It takes just a few minutes of training to learn how to administer the medication. You will use systems maps to develop your understanding of the key issues and to guide your recommendation of a solution.
You begin by mapping the basic system in which the problem occurs using a causal loop diagram. This map illustrates the fact that an increase (shown by a "+" sign) in excessive opioid use causes an increase in opioid overdoses, which causes an increase in opioid deaths.
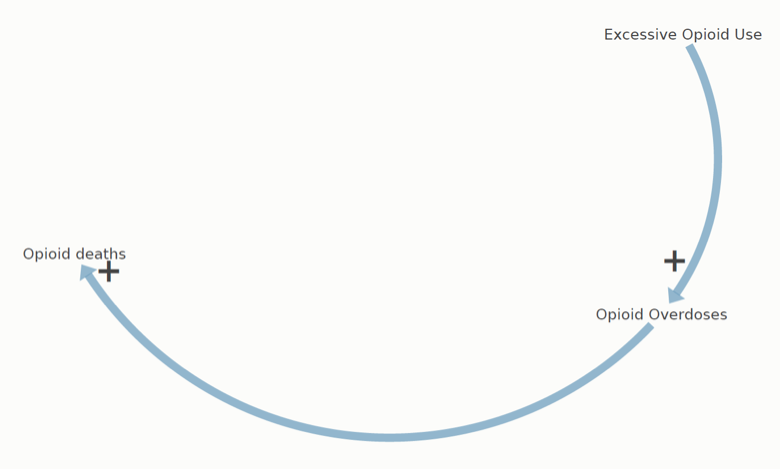
Even a simple systems map of a problem like this one can be useful in identifying points of intervention. The goal in this case is to reduce opioid deaths, so your solution must address one of the causes – opioid use or opioid overdoses.
Currently the city permits the use of Naloxone by first responders but not by community organizations. Some members of the commission believe that widespread use of Naloxone could reduce opioid deaths citywide. This is their theory of change for a proposed intervention:
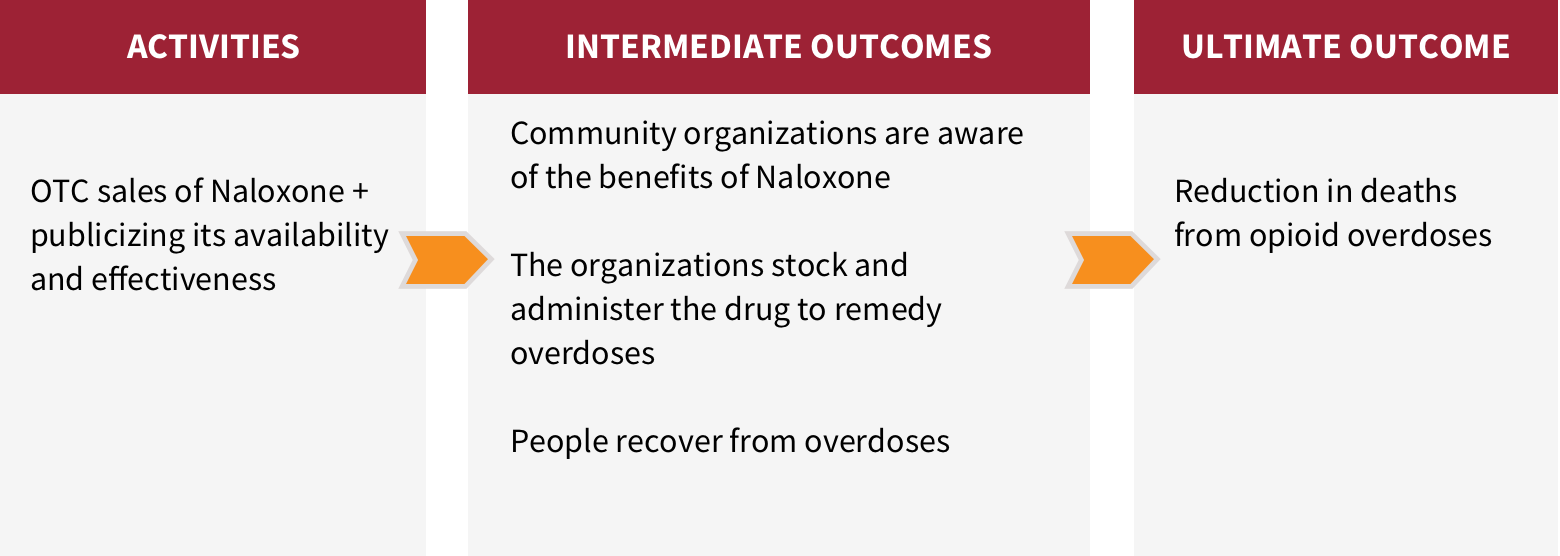
In case you’re not familiar with the concept, a theory of change—sometimes called a logic model—describes what activities an organization must perform to achieve its intended ultimate outcome. Typically, this requires achieving some intermediate outcomes on the path to the ultimate outcome. Watch a short video explaining what a theory of change is.
This theory of change describes the essential activities and intermediate outcomes needed to achieve the ultimate outcome of reducing deaths from opioid overdoses. The commissioners who support the theory believe that:
A theory of change is a hypothesis. It is only as good as the evidence supporting it. The commission is certain about Naloxone’s benefits. After consulting with local community groups, the commission is also sure that the groups are willing to stock the drug and able to administer it rapidly to counter opioid overdoses.
Watch the video to see how to build a causal loop diagram (CLD) for this proposed intervention.
Many of the commissioners believe that promoting Naloxone is the perfect solution to reduce opioid deaths in your city. The systems map of your planned activities and intermediate outcomes seems to support that logic:
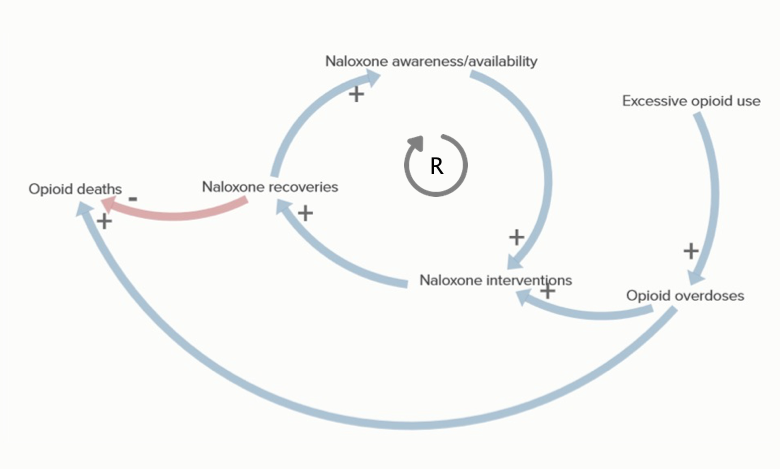
But skeptics on the commission suggest this is an incomplete picture. They are concerned that Naloxone availability will actually encourage people to use opioids, and this will increase the number of overdose deaths.
Watch the video to explore the possible unintended consequences and how to map them in the system.
Even the most well-crafted systems map can be difficult to interpret without a narrative explanation of what’s happening. The narrative can be a descriptive text in a paragraph or a set of bullet points. The most important thing is that you describe the causal relationships between major elements. This will help you communicate your hypotheses to others, and help others understand the rationale for your proposed interventions in a system.

The narrative for this systems map explains the hypotheses that:
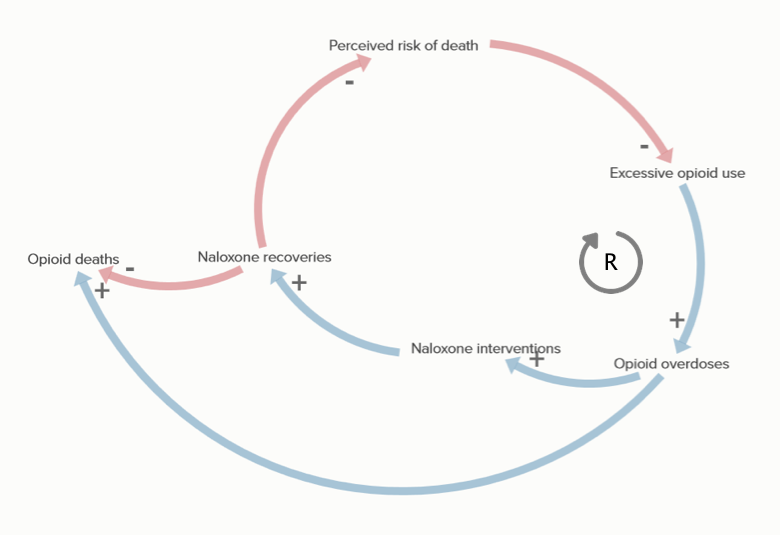
The narrative for this systems map explains the hypotheses that:
How can the commission determine whether making Naloxone readily administrable by community groups will reduce opioid deaths, or whether it will lead to excessive opioid use and more deaths?
Conventional evaluation techniques seek to infer causation from the correlation between an input variable (the availability of Naloxone) and an outcome variable (deaths resulting from overdoses). For example, you might compare opioid death rates before and after an intervention1, or compare a jurisdiction with the intervention to a similar jurisdiction without the intervention. These techniques seek to account for other possible variables besides the intervention that could contribute to the outcome. A randomized controlled trial (RCT) can do this much better, but it would be very difficult to conduct an RCT in this situation2.
These evaluation techniques look retrospectively at an intervention that has already taken place. By contrast, the systems map of the Naloxone intervention suggests that it may be possible to assess the competing hypotheses in advance by examining some of the key elements that influence opioid use:
All opioid users are not alike. You would want to understand the risk perceptions, motivations, and behaviors of different groups of opioid users, and determine whether they are affected by knowledge of the risks of opioid use. The groups would range from experimental users to people with chronic pain to addicts.
Although there are some published articles on these topics, you would likely engage in field research and consult with stakeholders with lived experiences of dealing with overdoses, whether as users or emergency responders or caregivers. It’s possible that addiction or the need to reduce physical or psychological pain may be greater than people’s concerns about the risk, and that many people may not have the will to avoid excessive opioid use regardless of their perception of the risks. You might find that neither the perception of opioid deaths nor Naloxone recoveries may have much impact on people’s use and overdoses of opioids.
The purpose of the Naloxone case study is not to lead you to a conclusion, but to broaden your understanding of the available tools to help you analyze the problem, craft possible solutions, and approach their assessment.
The boundaries of a systems map are determined by the problem the map is designed to help solve.
Your commission has the very specific mandate of considering the consequences of making Naloxone more widely and readily available. Our systems map examines the relatively immediate consequences, but the commission might be concerned with wider consequences as well. For example, would the proposed change in policy:
You could readily expand the map to include variables that reflect these questions and more.
You may wonder when the systems map stops growing. How do you know if you’ve mapped everything that could happen as a result of your intervention? The answer is you can’t. The systems map is merely a structured way to display the data points that you're currently aware of. It doesn't magically inform you about elements you didn’t already know about or at least hypothesize. It's a structured way of relating the data you're currently working with to each other. But a systems map can provide a foundation for brainstorming less obvious consequences.
A broader mandate for addressing the opioid problem would lead to a more comprehensive map that would include the causes of opioid use and overdoses – like the over-prescription of narcotics. And it would include approaches to preventing opioid use and overdoses, including interdicting drug trafficking, punishing drug possession and use, and providing drug counseling.
The specific focus on reducing opioid deaths by increasing the availability of Naloxone does not lend itself to a solution involving major systems change—especially if that means restructuring a system to address the problem’s root causes. Systems maps can be useful tools for a range of purposes – from understanding how a system works, to evaluating an intervention that is designed to make a minor change in a system, or one that would radically change a system.
Take a moment to review what you’ve learned about causal loops in a systems map.
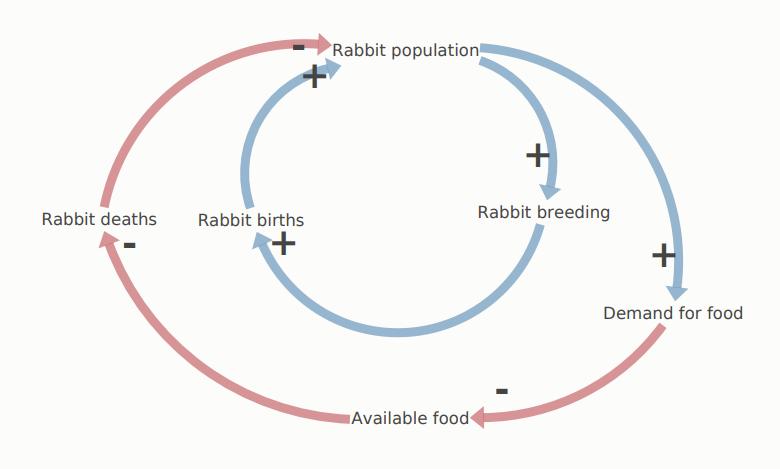
Because the universe is (mostly) finite, reinforcing loops tend to hit a limit at some point. That limit is represented by an offsetting balancing feedback loop.
The reinforcing loop leading to ever-increasing rabbit population is eventually countered by the lack of available food for the rabbits to eat, which stabilizes the population.
This phenomenon is so common that it is included in the array of recurring patterns known as systems archetypes under the name of limits to growth. You will learn more about systems archetypes in this course.
The goal of this course is to teach you to think in systems. Systems maps combined with narratives explaining how the system functions are helpful tools for doing this.
In this module, you saw how systems maps can be useful in considering a change in a public policy. The Naloxone example demonstrates the value of a particular kind of systems map—the causal loop diagram (CLD)—in exploring the forces that affect a problem, possible solutions, and potential unintended consequences.
Along the way, you learned about the grammar of systems maps and the two fundamental types of loops: reinforcing and balancing.
Here are some key concepts for you to keep in mind about systems maps:
Without a narrative, a systems map can look like a bowl of spaghetti. As the Naloxone example introduces systems maps, it also models the importance of a narrative that describes the elements and explains how they relate causally to each other.