MODULE 2
MODULE 2
In this module, you’ll consider how efforts to intervene in systems may have unintended consequences—for good, for bad, or that just frustrate your efforts to solve a problem.
Previously you explored the possibility that a Naloxone intervention intended to reduce deaths from opioid overdoses might actually increase the number of overdoses, and possibly increase deaths as well.
Here you’ll look at another public policy problem. Again using a causal loop diagram (CLD), you will examine the unintended consequences of a common solution to the problem of traffic congestion.
Imagine that you’re a county commissioner of a growing urban area that’s home to a research university. In recent years, many high-tech businesses have partnered with the university and built facilities near its campus. As a result, the main highway is increasingly congested. People are frustrated by their long commutes to work, with mounting adverse effects on businesses and households in the area. The traffic is threatening future economic development.
You and your fellow commissioners believe that adding another lane in each direction could significantly reduce automobile travel time for decades to come. Your belief flows from the everyday experience that several parallel processes are faster than one. For example, when one checkout line in the supermarket gets too long, opening a second line increases the speed of checking out.
Watch the video and learn how to convert the commission’s intuitions first into a theory of change and then into the elements of a causal loop diagram.
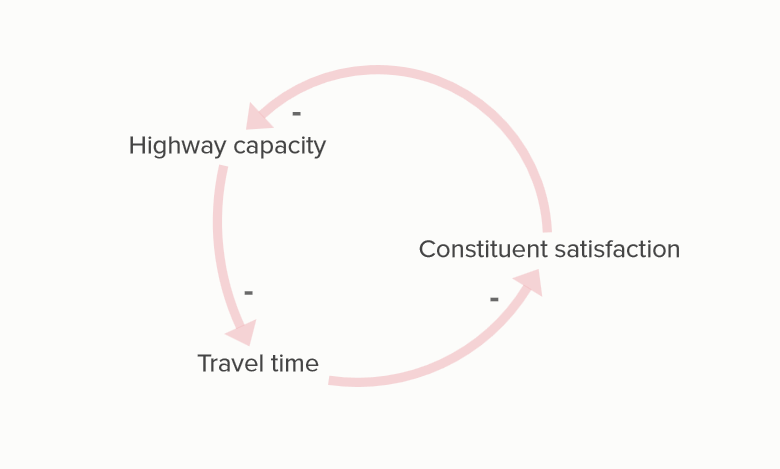
The traffic engineer advises that this basic systems map is incomplete. In particular, increasing highway capacity will have a number of consequences that you and the other commissioners have not foreseen. The consequences may hinder your solution of adding new lanes to solve the traffic problem.
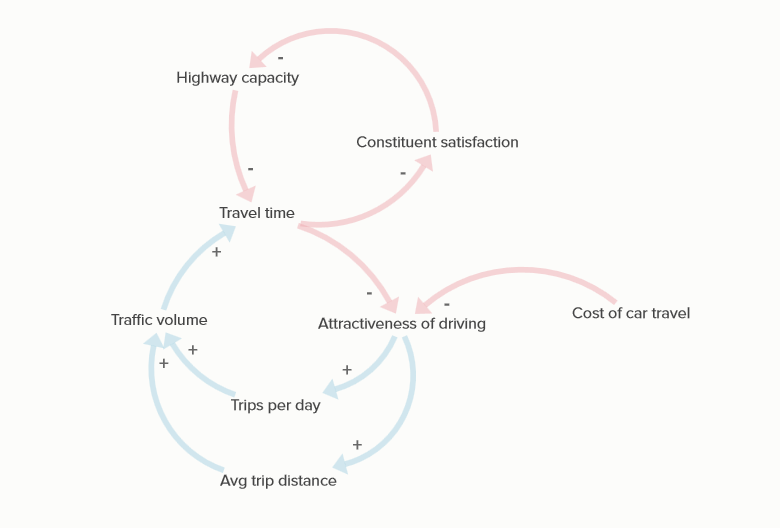
Watch the video to explore the possible unintended consequences of the intervention and how to map them.
The commission understands the complications described by the engineer, but would like to quantify the effects of an increase of highway capacity. For example:
You’ll recall that while a systems map shows the causal relationships between the elements, it can’t tell you the relative strengths of those relationships. For that, the engineer would need to gather empirical evidence—based, for example, on efforts elsewhere to reduce congestion by adding lanes. (For a glance at what the engineer might learn, do an internet search for "induced demand.")
If increasing highway capacity would not reduce travel time (by much) in the long run, what other measure could the county commissioners adopt? They might:
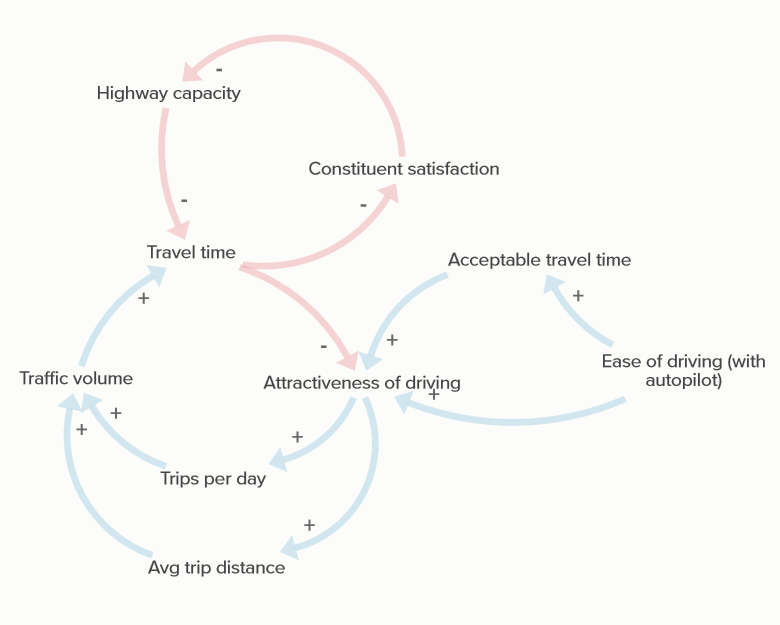
It is helpful to look into the future to anticipate influences on a system. Take a moment to reflect on what you’ve learned about the highway system and consider the effects of automated driving.
What might happen in the system if driving were partially or fully automated? Do you think people would drive more or less?
It’s reasonable to imagine that if an autopilot makes driving easier, then driving will be more attractive. (Consider the possibility of working or napping during your commute.) This causal relationship could be added to the systems map.
Indeed, research at the UC Davis Institute of Transportation Studies found that:
The study also surfaced anecdotal evidence that some Tesla drivers who previously commuted by bicycle were more inclined to move farther away and drive to work, and that some drivers who already commuted were inclined to move even farther away because a longer commute was no longer as much of a burden.
Systems thinking challenges you to ask: If things I want to change actually do change, what other effects will that have?
Systems thinking does not guarantee that you will imagine the unintended consequences of intervening in a system, but it makes it more likely. The process of mapping relationships among the visible and known elements of a system creates a mindset that helps reveal unseen elements.
Building a systems map is an art, not a science. Try to keep the map simple as you’re starting out. Remember to focus on the problem the map is designed to help solve. Accompany the map with a narrative. Once you feel confident in the fundamental elements and causal relationships, think of other factors that may help solve the problem or that may complicate its solution.