MODULE 3

MODULE 3
In this module you’ll look at oscillations. These are movements back and forth around an equilibrium point. If oscillations impair a system’s efficiency, you can often take steps to reduce them.
Here you will map oscillations in a causal loop diagram (CLD), and then learn how to use a stock and flow diagram to show people or things moving through a system.
Systems thinking is about understanding how a change in one element causes changes in other elements. Oscillations are a particular type of change.
Watch the video to learn more about oscillation and discover it in systems that you may encounter every day without thinking about it.
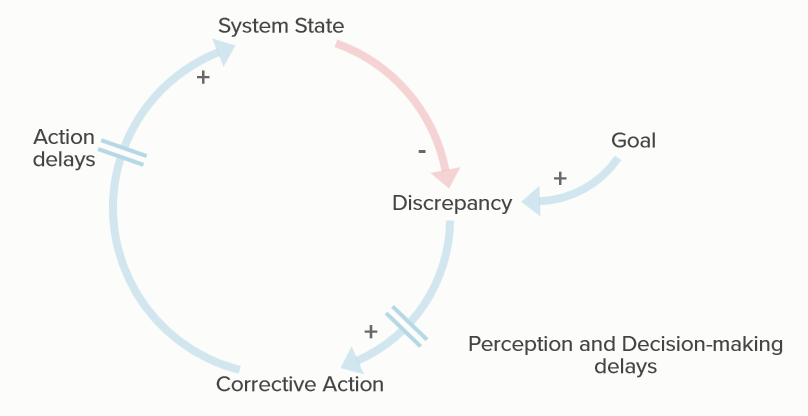
Oscillations happen in many systems. You’ll often find oscillations in balancing loops before they reach equilibrium. Oscillations are almost always the result of delays in a system, which cause it to overcorrect or undercorrect. A delay does not always result in oscillations, but it makes them more likely.

This map illustrates two categories of delays:
Delays impede feedback in a system. This can cause corrective actions to continue even after the system has reached its goal.
In the shower example, the size and consequences of the delays may be trivial. But in a system where the stakes are higher—such as a military operation or a hospital—delays can compound, and can shift the outcome from life to death.
Anticipating oscillations is an important first step toward controlling them.
Almost all systems have delays. As a systems thinker, you’re most concerned with delays that impair the functioning of a system. In general, you want to reduce the size of oscillations and reduce the amount of time a system is out of balance. The sooner you can get to smaller or zero oscillations, the better off you are.
For example, consider efforts by central banks, such as the United States Federal Reserve, to control inflation by increasing interest rates. To avoid overshooting and causing a recession, the Fed tends to make incremental changes to interest rates and wait until the changes take effect before making further adjustments.
Watch the video to see how oscillations are reduced in another familiar home example, and a scenario involving regulations designed to reduce the spread of Covid-19.
When you’re in the shower, the goal—your desired water temperature—doesn’t change. But in many systems, the specific goal may change in real time. The combination of delays and changing goals within a system can produce significant oscillations.
Watch the video to see how a car dealership manages oscillations in response to changing consumer demand. This example comes from Donella Meadows, a pioneer in systems thinking.
A systems map showing causal loops can tell you a lot about oscillations by showing how one variable influences another—for example, how consumer demand for cars affects orders to a car factory.
Stock and flow diagrams are a different way to map systems. They help you develop a different perspective by showing the movement of items or people through a system.
Flows control the rate at which a stock increases or decreases.
Watch the video to continue the car dealership example using a stock and flow diagram.
A supply chain for cars or any other product is a system. Watch the video to learn about the bullwhip effect in product supply chains, and the importance of understanding where delays may occur in a system so that you can plan how to manage them.
The field of supply chain management, an application of systems dynamics, focuses on how to reduce inefficiencies. In the 1960s, MIT professor and systems pioneer Jay Forrester developed The Beer Distribution Game as a fun way to introduce students to concepts of systems dynamics by having them play roles in the beer supply chain.

Today the classic game still provides valuable insights into the impact of delays in supply chains. When the game starts, consumer demand for beer is constant. But at some point, consumer demand suddenly increases, which triggers a reaction by each player in the beer distribution chain, and results in wild oscillations. You can experience the beer game and its challenges on the Beer Game app.
Most systems eventually come into balance. Recall that even reinforcing loops like rabbit reproduction are usually counteracted by balancing loops such as capacity of the food supply, which limits the rabbit population. But systems often oscillate – or move back and forth – before achieving equilibrium. If you identify the oscillations, you often can take steps to reduce them to stabilize the system.
Here are some key concepts to keep in mind about oscillations:
References
Hau L. Lee, V. Padmanabhan & Seungjin Whang, Information Distortion in a Supply Chain: The Bullwhip Effect, 43 Mgmt. Sci. (1997).
Donella H. Meadows, Thinking in Systems: A Primer (2008).
John D. Sterman, Business Dynamics: Systems Thinking and Modeling for a Complex World (2000).